Format: horizontal or vertical
Vertical
02
Types of Infographics: Three from the list above or other research.
Data visualization, map, copy(text)
03
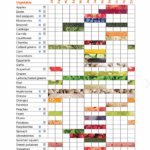
Information: The information you want to bring in with examples of the data as tables, lists, etc.
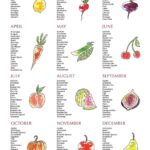
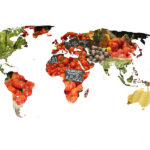
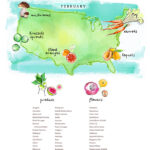
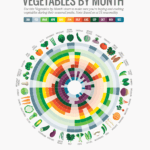
Every month, every part of the world experiences what seasonal crops shown in map form. USDA information on imports to other countries. A closer look into specific countries or regions.
04
Titles:
- What is the headline? Working titles: Eating With The Seasons, Journey of Produce, Local or Cargo
- What is the subhead? Where is your produce coming from and when?
- A short introduction sentence or sentences. This graph illustrates the seasonal availability of various fruits and vegetables, along with the regions where they are harvested.
05
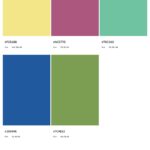
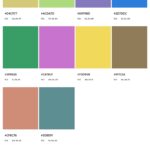
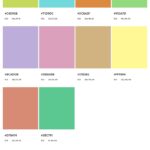
Color schemes: bring a few 5 color color schemes
06
Thumbnails:
- Thumbnails sketches of whole design
- Detail thumbnails of specific sections
07
Inspiration Gallery: A few examples of styles you admire and may want to emulate