Format: Horizontal 5 slide Instagram Carousel – 1000px x 5000px
Types of Infographics:
- Bar Chart
- Timeline/Diagram
- Data Visualization
Information:
https://www.kcra.com/article/charlie-kirk-political-violence-united-states/66054815
https://en.wikipedia.org/wiki/List_of_United_States_presidential_assassination_attempts_and_plots
https://www.motherjones.com/politics/2012/12/mass-shootings-mother-jones-full-data/
Titles:
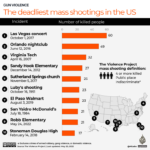
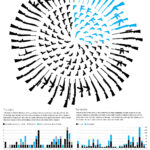
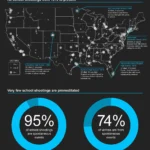
Political Shootings In The U.S. (2000-present)
Are shootings getting more violent?
The current political climate is extremely polarizing, and this infographic shows whether shootings in recent times have gotten more violent.
Color schemes:
Thumbnails:
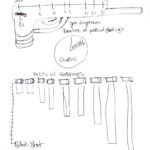
Inspiration Gallery: