Breif Description
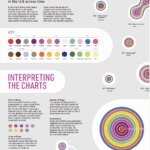
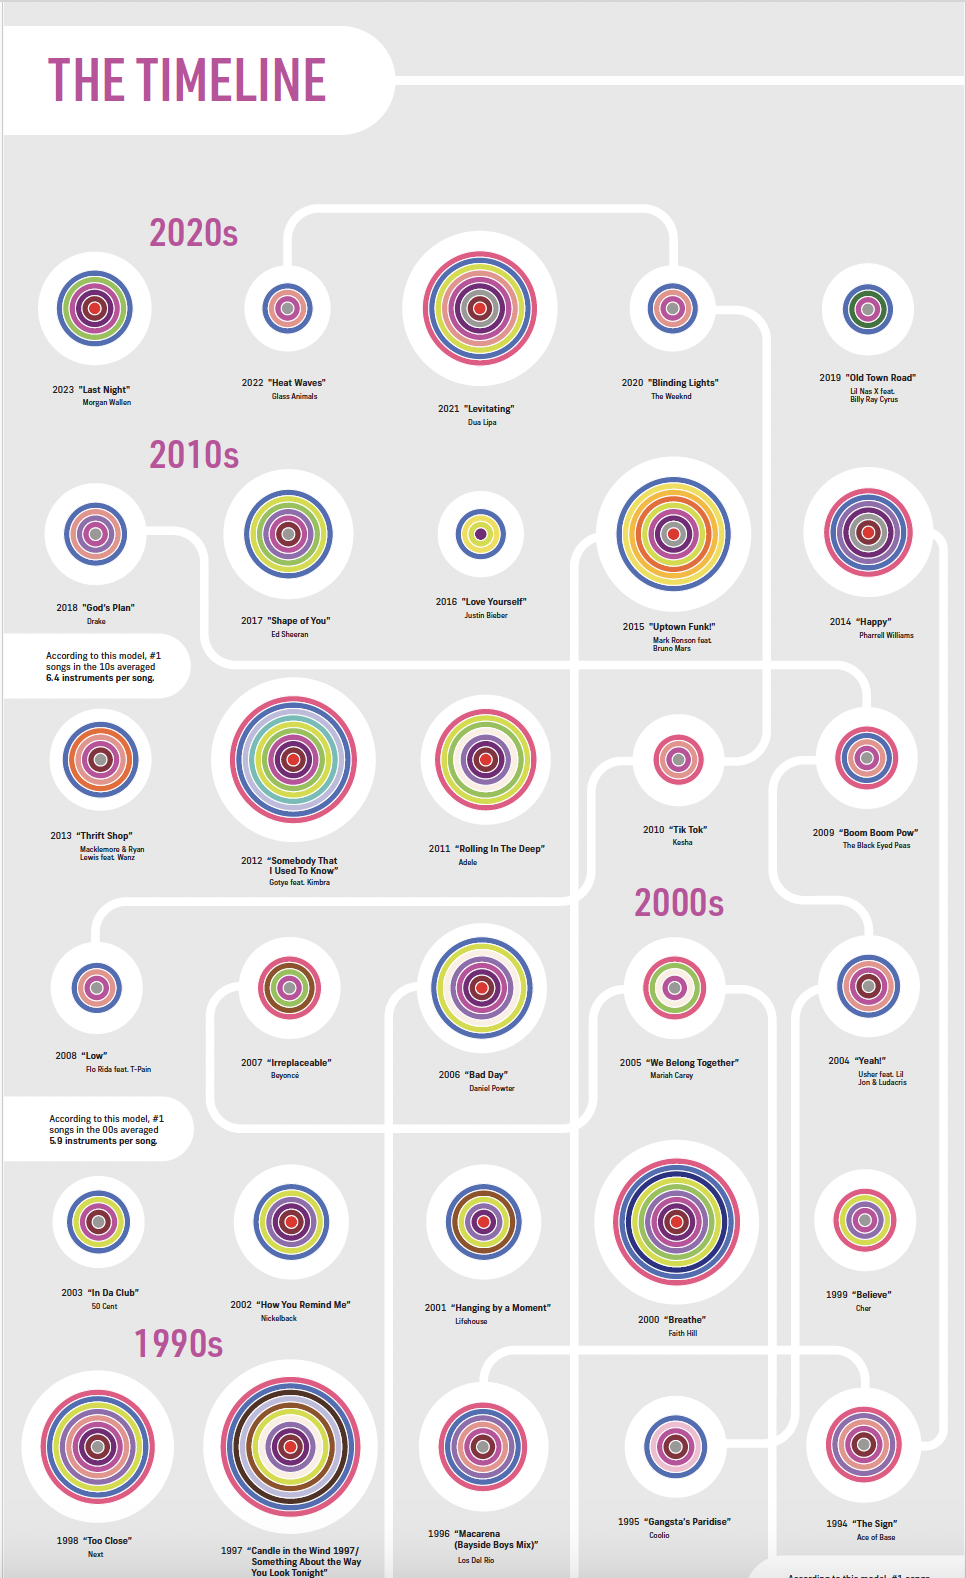
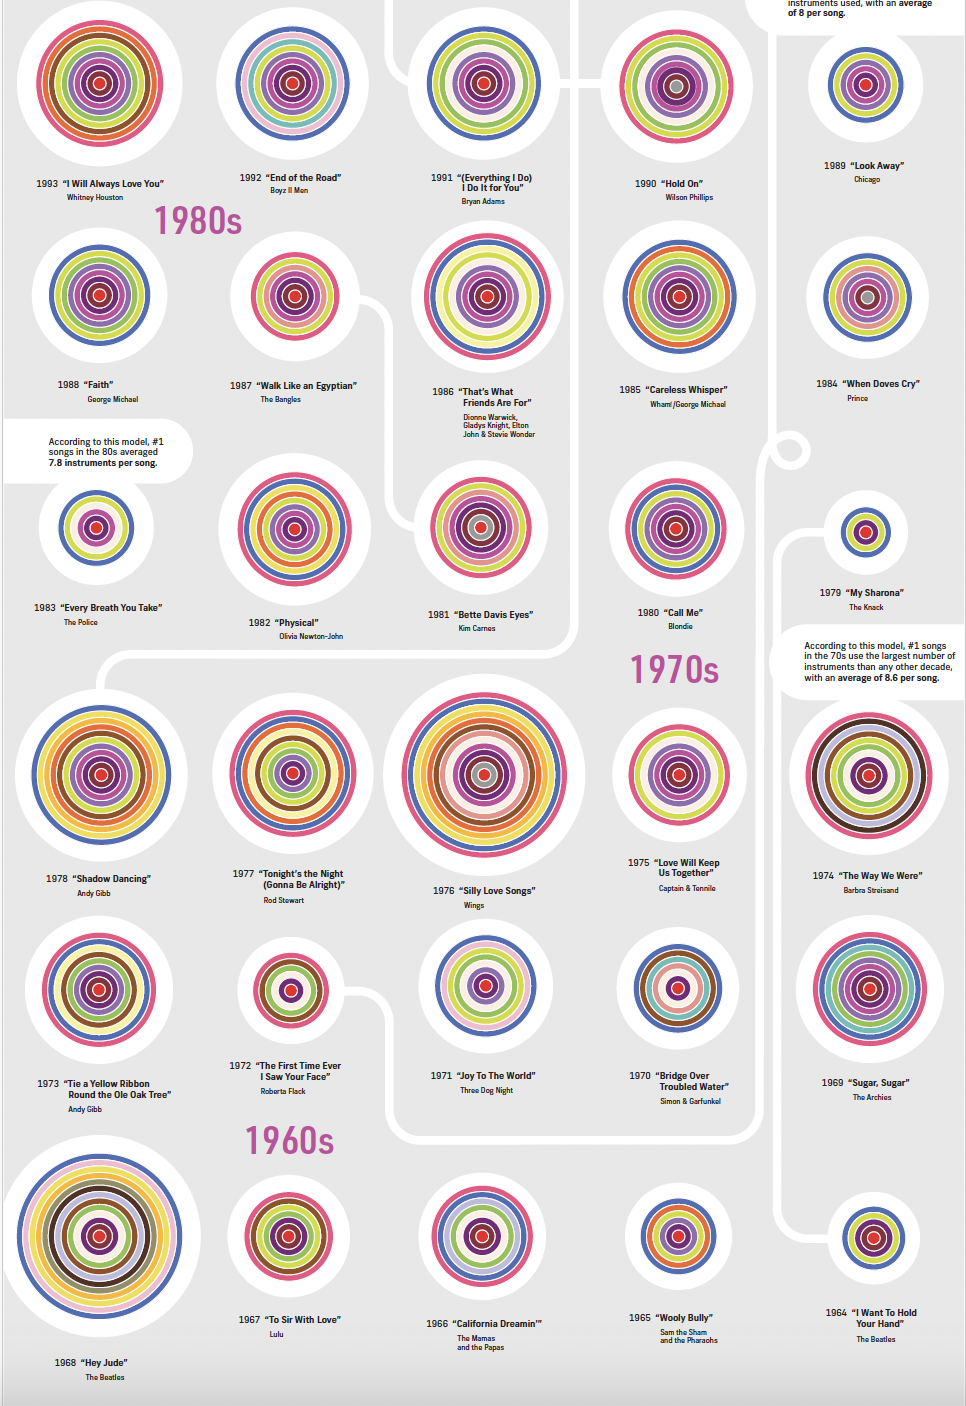
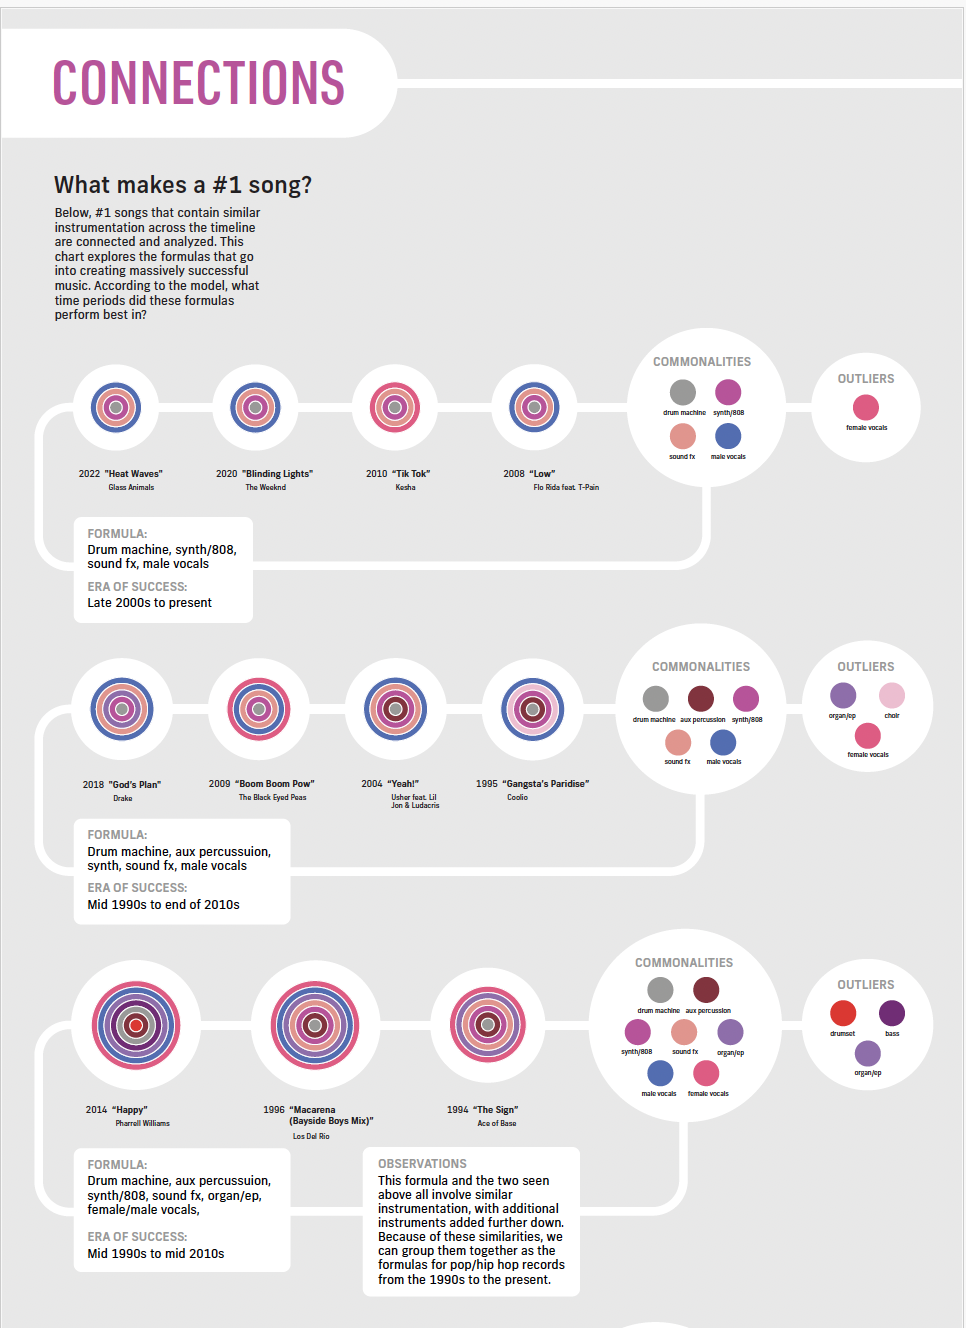
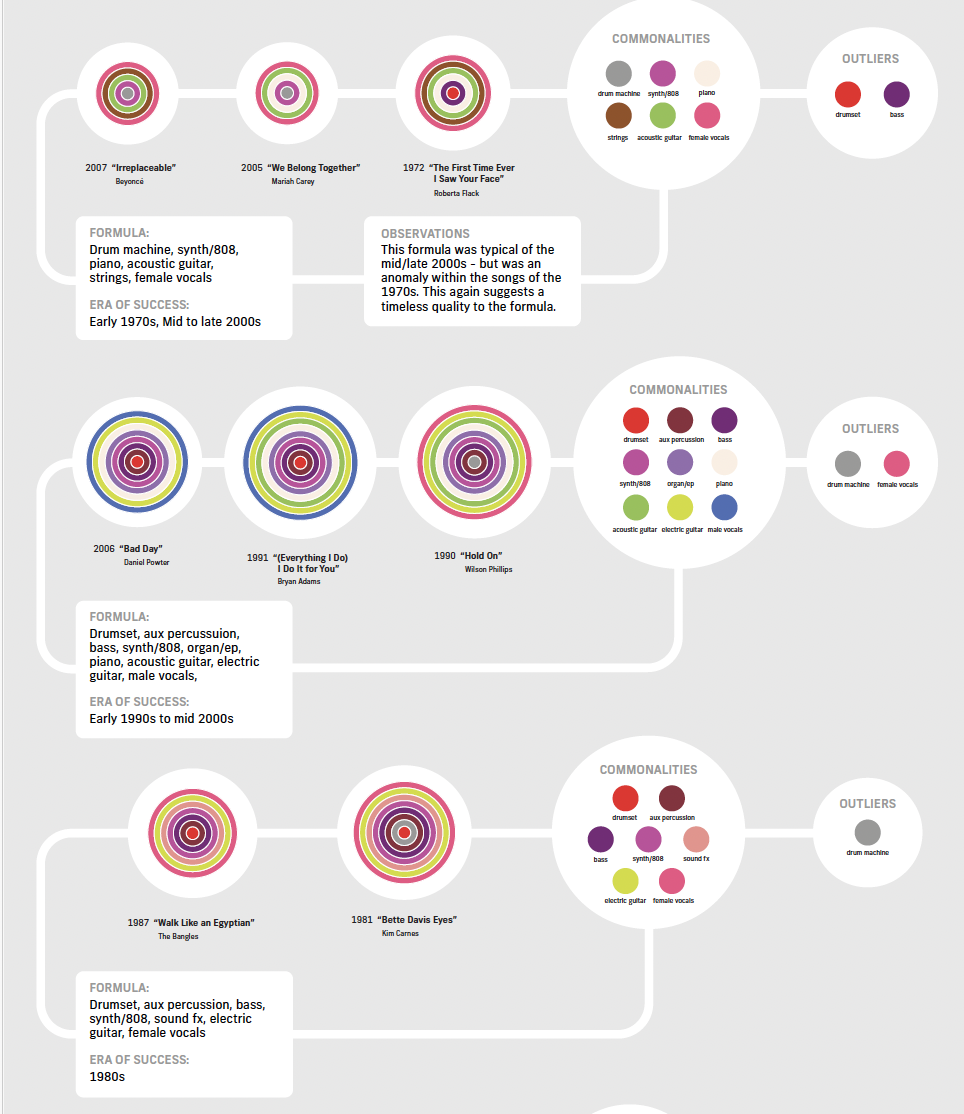
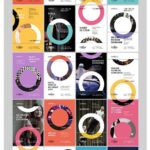
This project focuses on comparing the instrumentation of #1 songs from every year, over 60 years. Instruments that are present are represented by a color, creating a unique chart for each song. These charts are then compared to one another to find patterns and formulas
Article Research:
Interview with Max Martin, who has written 28 #1 songs
– New York Times
“Polymath” musician Tom Scholz of Boston
– MIT Technology Review
List of artists with the most #1 songs
– Billboard
Are there really fewer real hits today?
– Graphsaboutsongs.com
– Penn State
Music history from primary sources
– Library of Congress
– WordPress
Image Gallery
Links used in Infographic
Final Infographic