01 – Titles & Subtitles
A Seven-Day Sonification:
A Visualization of My Music Habits During the Week of September 21st – September 27th, 2025.
Artificially Flavored:
How Spotify’s Algorithm Is Manufacturing Your Next “Favorite” Song.
The Playlist is a Diary:
And Spotify is Reading It. How Your Data Becomes the Perfect Recommendation.
Algorithmic Intuition
How Spotify Listens to Your Life, One Skip at a Time, to Find the Song You Never Knew You Needed.
The Algorithm in the Mirror
It Doesn’t Just Recommend Songs. It Reflects You. How Your Data Becomes Your Digital Twin in Music.
02 – Article Contents
- Opening Spread
- An imagery-focused spread that draws the user in, but doesn’t provide too much information
- LARGE type
- Specific charts from your infographic
- Bubble graph that showcases song repetitions
- Energy heat map
- Average energy level chart
- Main article
- Smaller article
- Full spreads
- More image-focused spreads that lean editorial. My goal is to do some photo shoots with some friends and include the imagery as the primary visual assets in my magazine. I have been doing some photoshoots to prepare, but I want to get a little more editorial. I aim to make all imagery included in the magazine.
- Sidebars
- A breakdown of the difference between ML and AI
- A personal story/fun fact (connecting it back to the information, reflecting my personal music taste)
- Top 10 Songs of the Week
- Smaller elements
- Smaller imagery and media elements
- Scanned and bitmapped imagery
- Something reoccurring on every page; A motif of some kind.
03 – Type Pairings
They’re in the Dropbox…
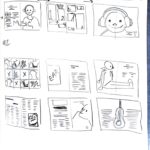
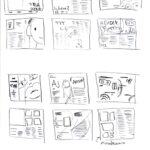
04 – Thumbnails
05 – Mood Folder
They’re in the Dropbox, too…