Create an infographic on a topic of your interest that communicates specific concrete information in a visually engaging way.

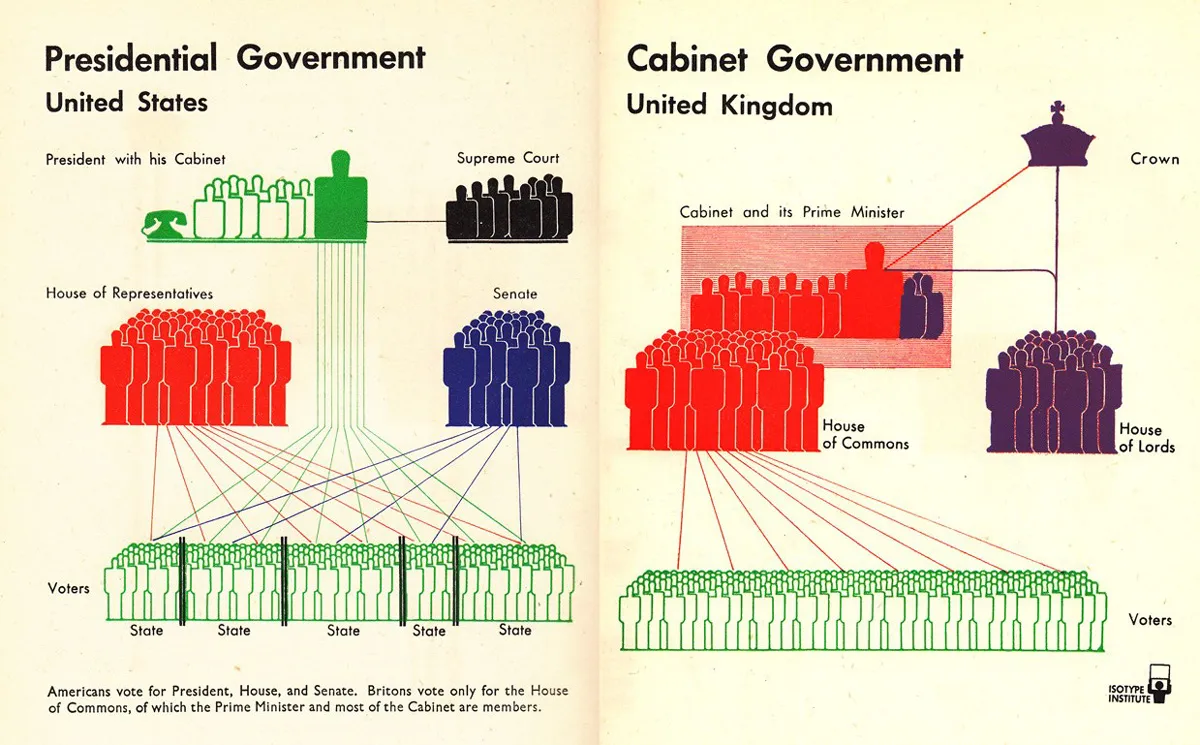
An infographic is a powerful way of communicating ideas in a visual form. Different types of infographics are used in design and marketing to present information in a simple and visually appealing way.
—Adobe
“Infographic” is a portmanteau of the words “information” and “graphic.” In essence, an infographic is a form of visual communication meant to capture attention and enhance comprehension. In this era, “infographic” has become the broadest descriptor of a specific type of visual communication that includes graphics showing data, copy, or both.
— ColumnFive
Infographics are graphic visual representations of educational content, used to deliver complex information, disseminate scientific research, and drive behavioral change.
— National Library of Medicine?
Infographic Types
- Data visualization — charts & graphs and more
- Copy (text)— tells a story in short sentences, narratives, and single stats (example: 90% of cell phone uses develop ADHD)
- Visual Narratives — Illustration complex ideas or processes using images (example: recipe, types of dogs, etc)
- Concept Maps — these create images and metaphors that depict concepts (such as the pyschology of cats, or atomic fusion)
- Timeline —the primary organization is time
- Map — uses location as the primary focus. Not necessarily geography — a diagram of a bike is a map.
- Diagram — Map of an object or process.
- List — an collection of images or words that communicate an idea (top ten, a taxonomy, etc)
- Editorial — These express the opinions and perspectives of the author. See Chartgiest page
- Other type — there are more variations on these. Explore and discover them.
Choose from the following formats:
- Horizontal 5 slide Instagram Carousel – 1000px x 5000
- Vertical 3 screen web page scroll — try 1500 x 9000 px
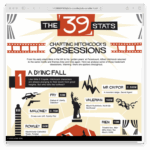
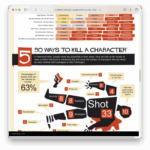
Hitchcock Scroller
Include at least 3 Data Types in your infoGraphic
Choose at least three Infographic types one of which must be data visualization. You can have more or use less depending on the complexity of your infographic.
-
Primary Data Visualization or information concept
-
a second supporting data type
-
another type of data
Explore these Readings
Progress Post
Category: 02 Info-Progress
Create a progress post that features the following.
01
Format: horizontal or vertical
02
Types of Infographics: Three from the list above or other research.
03
Information: The information you want to bring in with examples of the data as tables, lists, etc.
04
Titles:
- What is the headline?
- What is the subhead?
- A short introduction sentence or sentences.
05
Color schemes: bring a few 5 color color schemes
06
Thumbnails:
- Thumbnails sketches of whole design
- Detail thumbnails of specific sections
07
Visual and graphic style experiments or your own
08
Inspiration Gallery: A few examples of styles you admire and may want to emulate
09
Start a folder on DropBox with Process files organized for viewing.
Remember, our target platform is a mobile phone so the graphics and text need to be simple and readable on these devices.
Monday, October 6, 2025
Infographic Progress Post
outlined above
Category: 02 Info-Progress
In class: review posts
Wednesday, October 8, 2025
First Draft of Infographic — v1
- Filename: lastname_infographic_v1.pdf
- Upload to dropbox to folder: 02 Infographic
In Class: Small group discussion and Work in class
Friday, October 10
Final Receipt Poster
Please do the following:
- Open the AI and “Save as” lastname_reciept_final.pdf
- Delete all other poster versions except the final two. Clean it up!
- Save the final poster file again with just the two artboards
- Export/”Save as” a PDF the two poster final .ai as a “smallest file size” PDF
- Must be export with crop marks and bleeds — 0p9 or .125”
- Make sure the name is: lastname_reciept_final.pdf
Upload the PDF to:
Monday, October 13, 2025
Two Full Version Comps of Infographic — v2
- Filename: lastname_infographic_v2.pdf
- Upload to dropbox to folder: 02 Infographic
In Class: Small group discussion and Work in class
Upload here:
Wednesday, October 15, 2025
Watch the Tutorials
Illustrator Template
lastname_info-template.ai
01
WALL VIEW
Print, Tile and Tape Your infographic.
Print to fit and hang on wall.
- 11″ width for vertical
- 11″ height for horizontal
02
WEB VIEW
Export for web viewing — Example on Website
Use this template to display it: info-scroller
- This is
- a scrolling
- web template.
03
UPLOAD
01
Upload Web View Folder to DropBox
Upload Revised Comp of Infographic —v2.5
- Filename: lastname_infographic_v2.5.pdf
- Class Shared Upload Folder
- Upload to your dropbox folder too.

It should look like this.
In Class: Large class crit
Monday, October 20, 2025
Penultimate Infographic Due
Class Discussions and Final Tweaks
Upload version 03 to dropbox
- Upload PDF
- Upload Web Viewer
Filename: lastname_infographic_v3.pdf
Upload Files Here
Wednesday, October 22, 2025
Final Infographic Critique
With Visiting Critic Erica Pritchett
Upload your Final Infographic files in a folder
called lastname_Infographic_v4 to :
Horizontal Formats
- Upload Final PDF
- Upload a folder of the individual images to put on instagram
I will post these to ksc_graphicdesign
Vertical Formats
- Upload Final PDF
- Embed image into the “info-scroller” web page
Critique Order
- Katie
- Molly
- Judan
- Cayla
- Julia
- Sawyer
- Cam
- Jack
- Tyler
3 PM — 5 Minute break - Jamielee
- Grayce
- Amelia
- Anna
- Marshall
- Calder
- Grace
- Michael
- Henry
Crit end at approximately 4:10


